
Turn your Excel into a powerful financial software
Calculate value of financial instruments, assess risks and validate models with GIAnalyzer for Excel – a powerful and flexible analytical tool designed for finance practitioners.
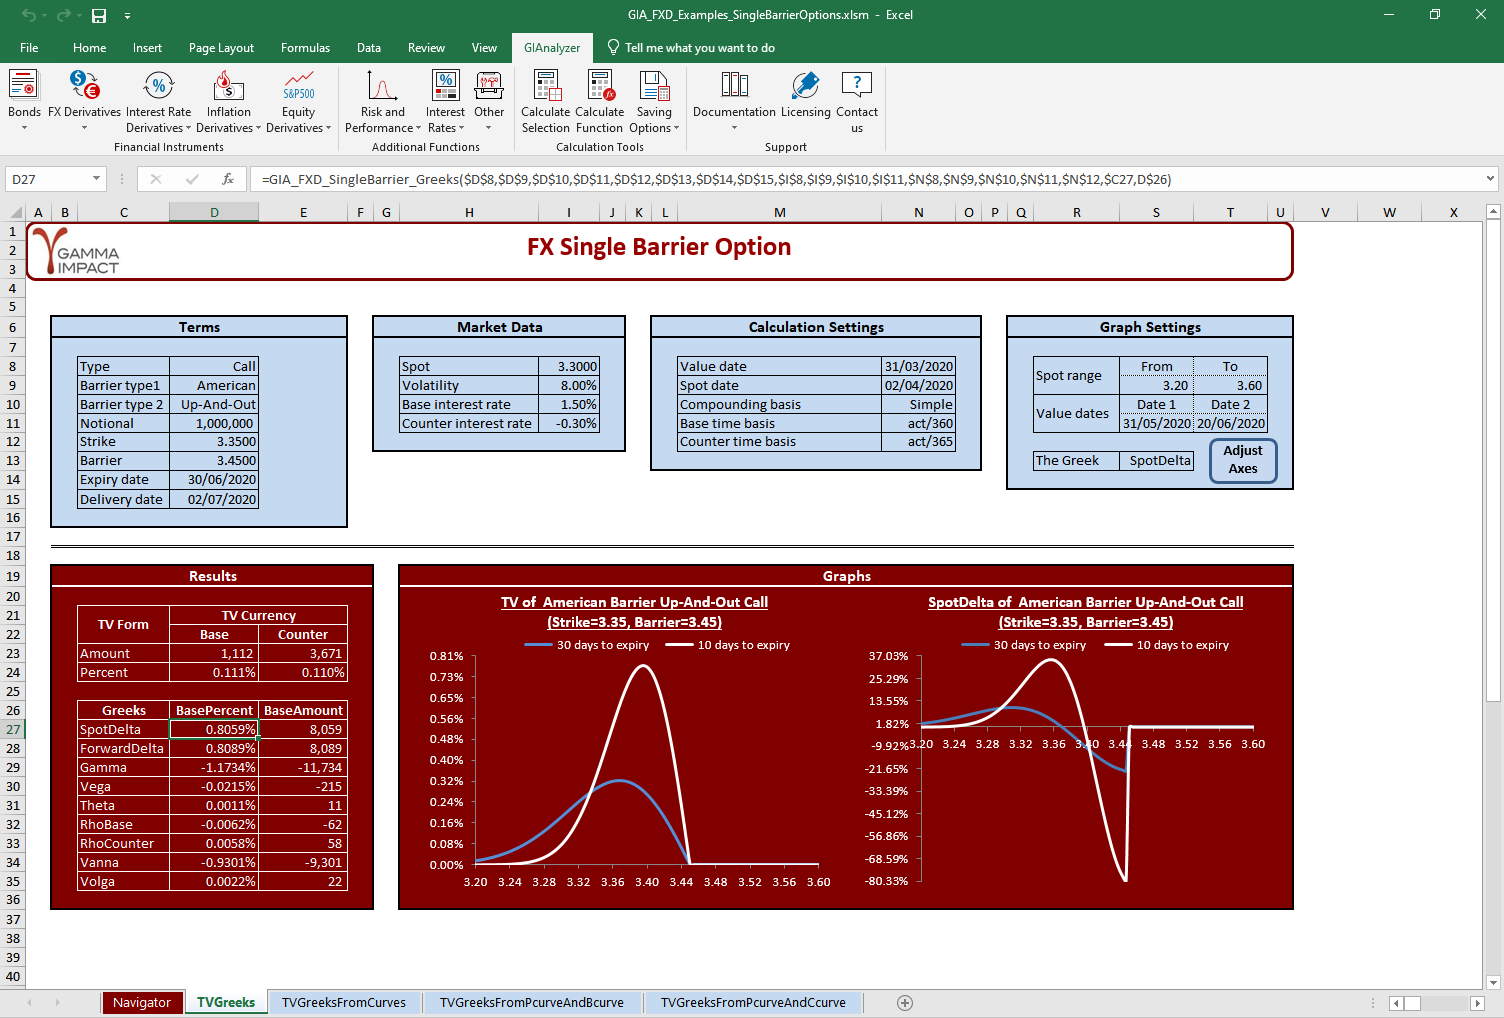
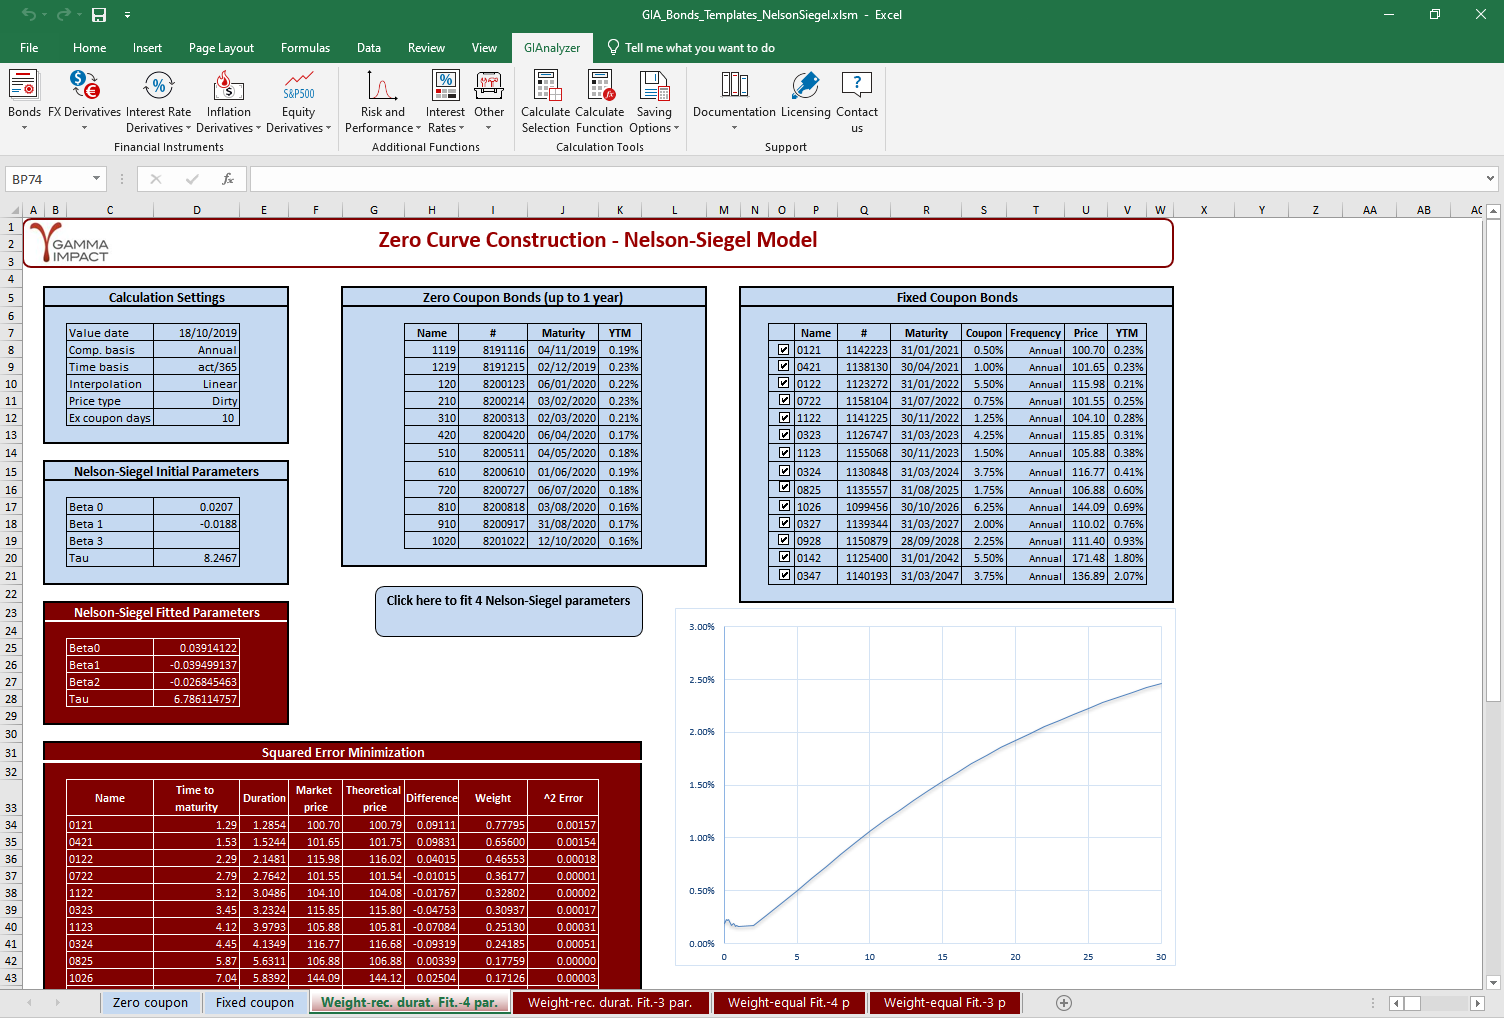
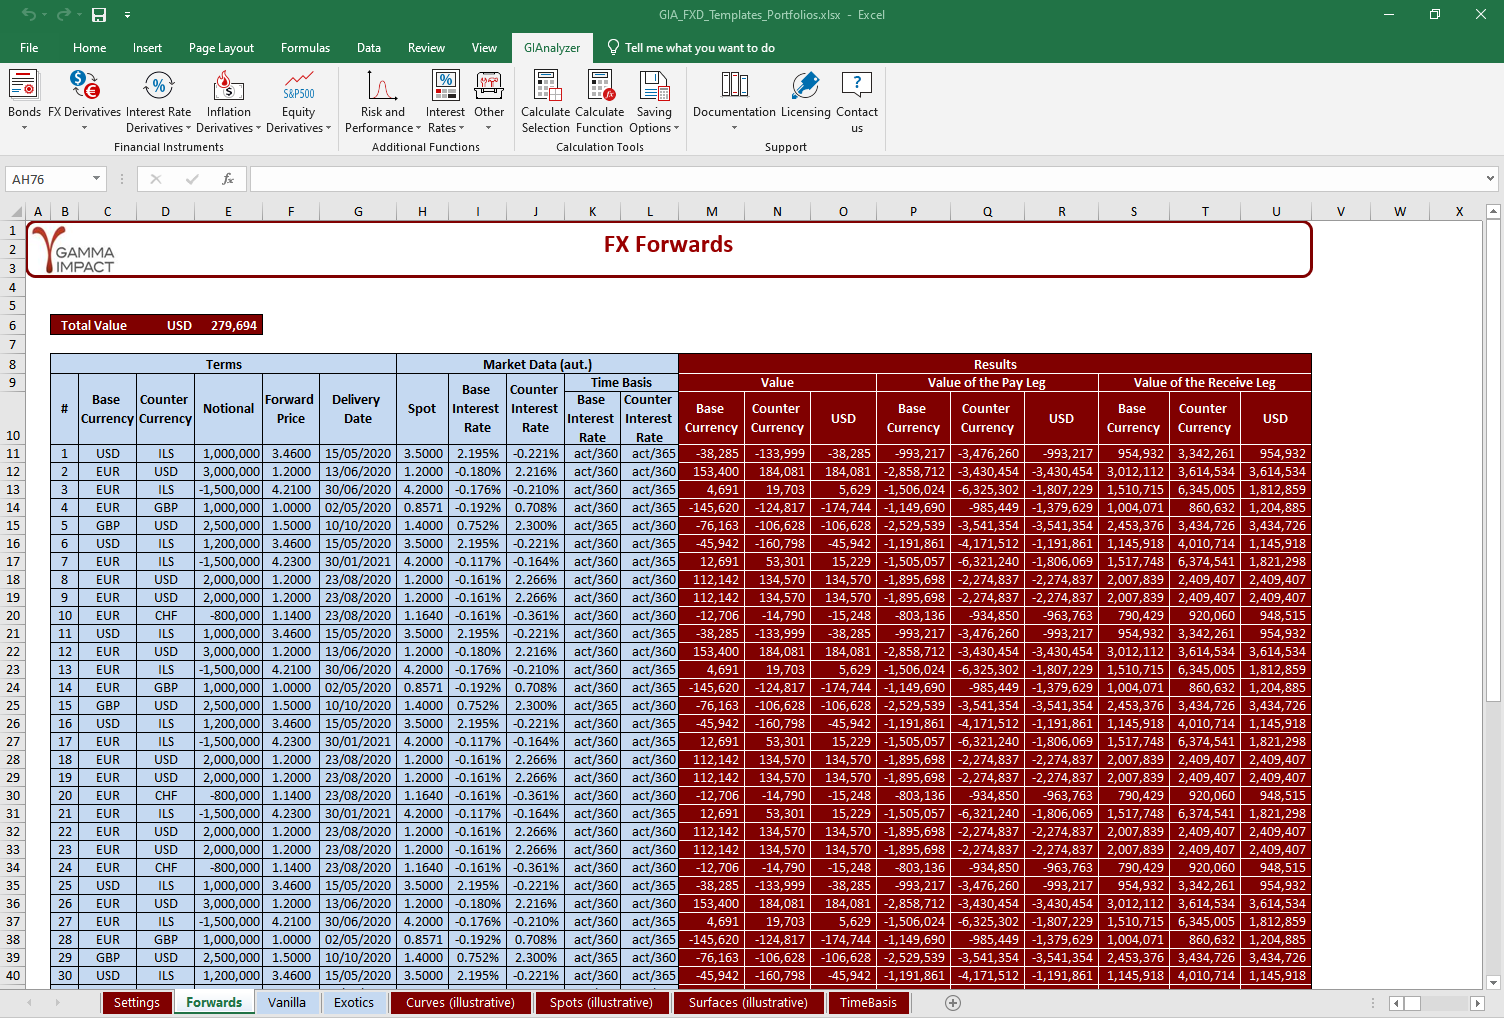
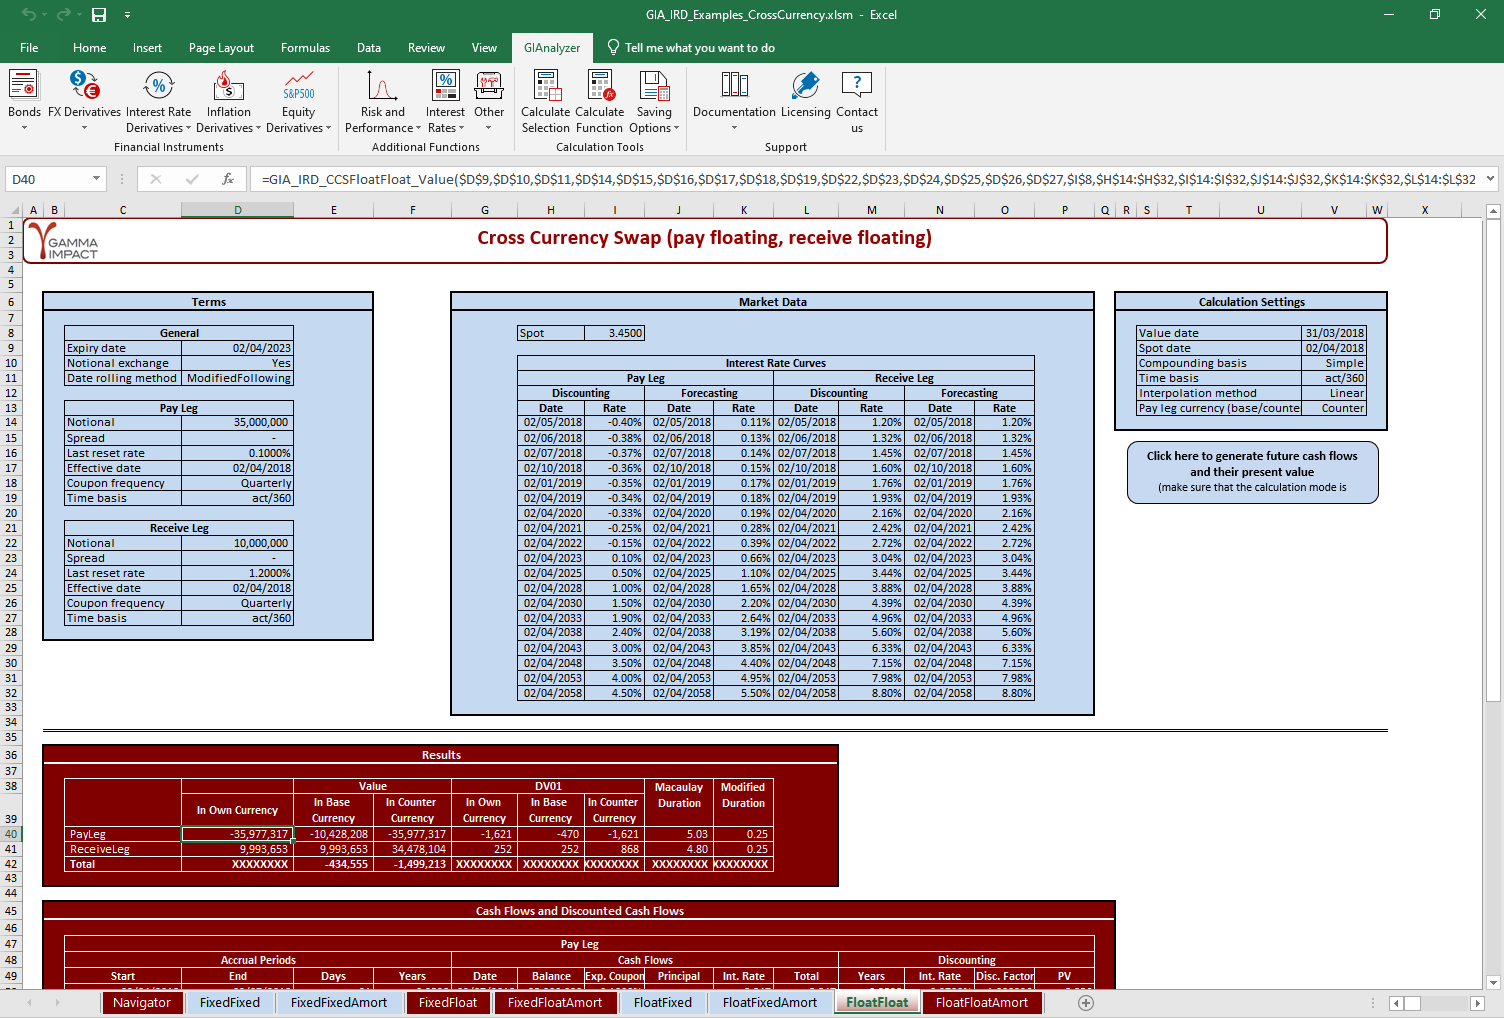
A reliable and nimble solution
We’ve designed GIAnalyzer to be user‐friendly and easy to learn and apply
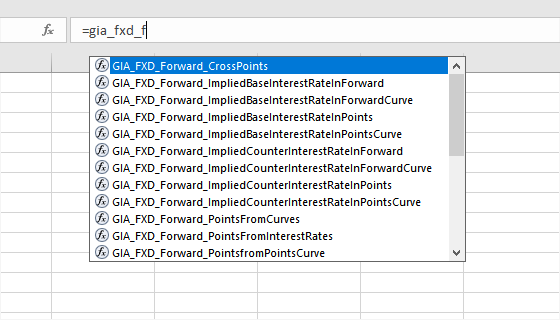
Once installed, GIAnalyzer becomes a part of Excel. Thanks to the well-thought-out toolbar, GIAnalyzer is intuitive to use from the very start:
- Functions are arranged into task-specific modules, so you can find the function you need in a click
- Functions and parameters have self-explanatory names, with no obscure abbreviations
- Parameters across all functions follow the same consistent order and are easy to identify
330+ functions to boost your efficiency
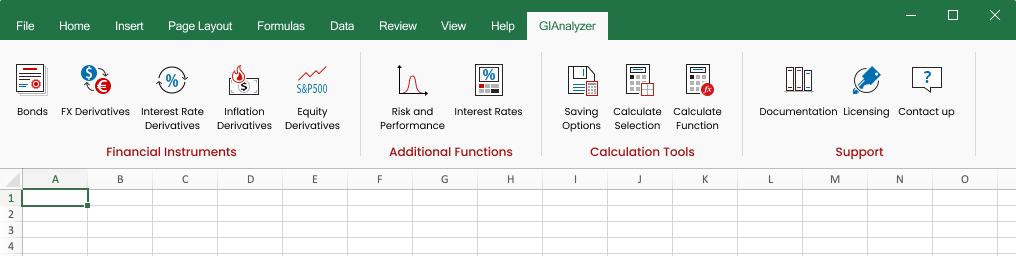
Functions are grouped into task-specific modules on a compact toolbar
- Financial Instruments
- Additional Functions
- Calculation Tools


Click on a module to learn more about it
Vast application areas
Used in treasury, trading rooms, risk management, ALM, accounting, audit and more

Valuation of financial instruments
Perform fair value calculations of bonds, vanilla and exotic options, ESO, interest rate derivatives and inflation derivatives.
You can incorporate market data, such as interest rate curves and volatility surfaces, and enter the data manually or source from market data vendors.
Model validation
Effectively validate models by independent calculations, which is key to a rigorous validation process.
Using different sources of market data can clarify whether differing results are due to the code or the data.
Risk assessment of financial instruments
Perform risk assessment either using risk measure — such as Greeks, DV01, Modified Duration and Convexity, or running a Full Valuation approach — such as stress scenarios and Value at Risk.
You can perform the analysis for an individual financial instrument or for portfolios with multiple financial instruments.
Risk and performance analysis and research
Calculate various risk and performance measures: volatility, correlation, frequency, percentiles, beta, Sharpe ratio, etc.
You can set parameters: start and end period, historical data range to be excluded, the length of the price change period, and more. Most calculations can be performed using overlapping or non-overlapping changes.
Interest rates calculations
Perform various calculations involving interest rates and interest rate curves: transition from interest rates to discount factors and vice versa, conversion of interest rates from one compounding and time basis to another, different types of interpolations, forward rates and building zero coupon interest rate curve using Nelson-Siegel model.
Download now and try free for 30 days.
Fully featured version, no credit card required.

Windows 7 – 10
Frequent questions
Is there GIAnalyzer version for Mac?
No. GIAnalyzer is only supported for Windows. But you can use it on Mac if you use Excel on a Windows virtual machine.
Is there a free trial?
Of course. You can try the full version of GIAnalyzer for free for 30 days. No credit card required. Start here.
Where can I find documentation?
Detailed documentation and user guides are available in the Knowledge base.
I don’t need all functions. Can I choose what to buy?
Yes, you can assemble your own license and choose only the modules you need. You can also choose a comfortable subscription period for 1, 2, or 3 years. See pricing.